
Wiemer, Joey: wOBA 0.508 vs xwOBA 0.315
15 games on the slate / 4 live / TB +23.5 vs projection / Wiemer, Joey regression watch
15 games on the slate / 4 live / TB +23.5 vs projection / Wiemer, Joey regression watch
 Interactive 3D →
Two pitches that leave the hand on the same line and split late. From the hitter's eye they are nearly one pitch at the commit point, then break 18.3″ apart by the plate.
 Play now →
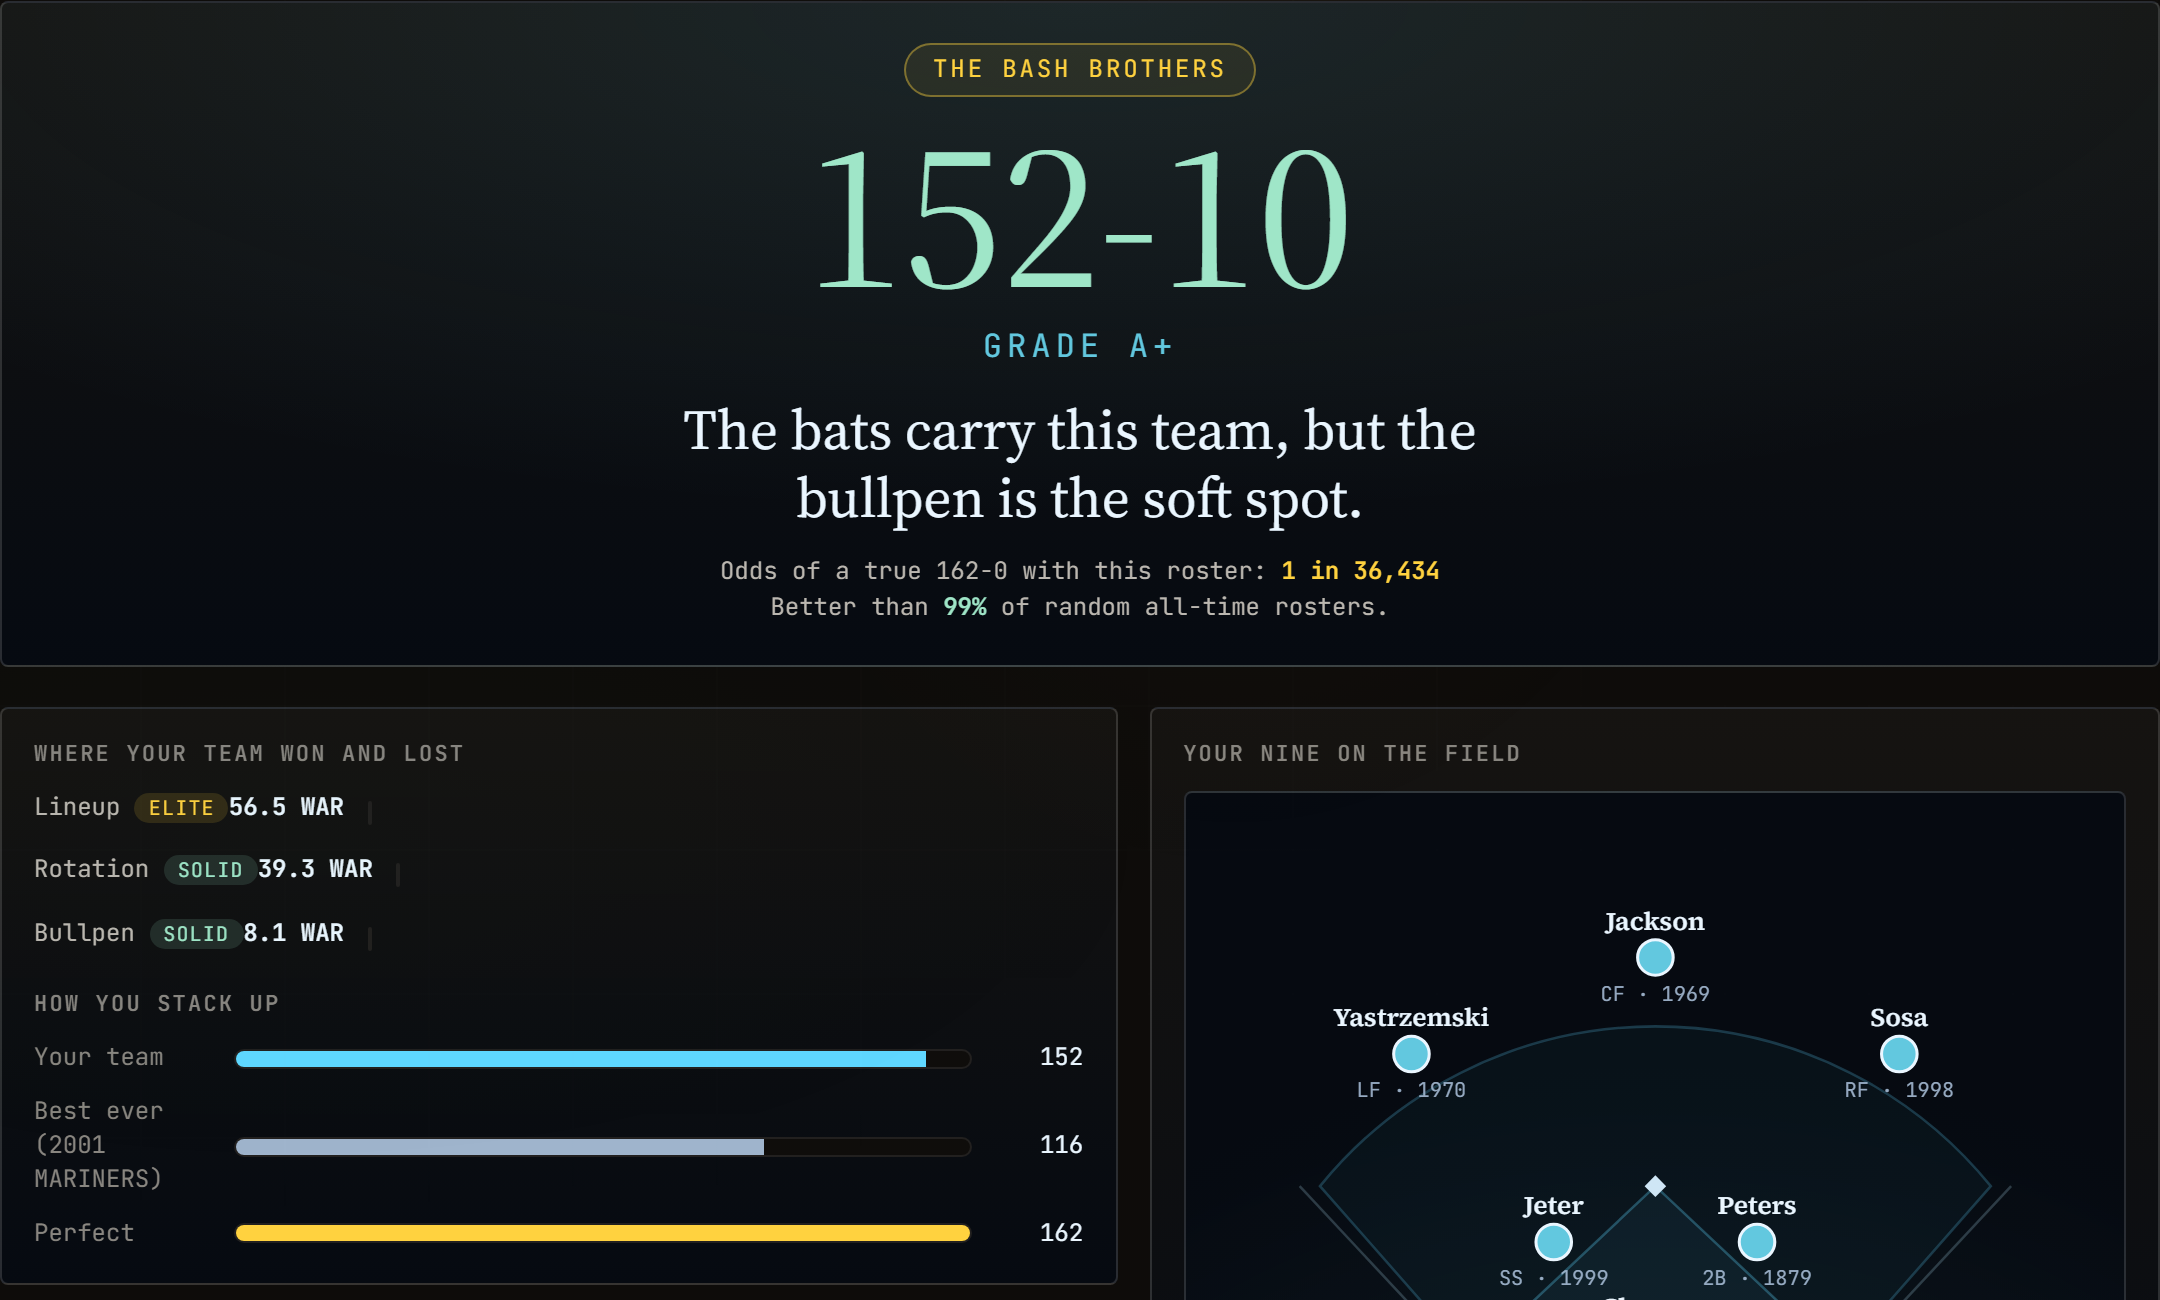
Our take on the viral 82-0 game, built for baseball and backed by a real engine. Spin a random franchise and era, draft a full roster across 150 years of players, and we run your team through an era-adjusted simulation into a record, with a full analytical breakdown of the season.
 Interactive 3D →
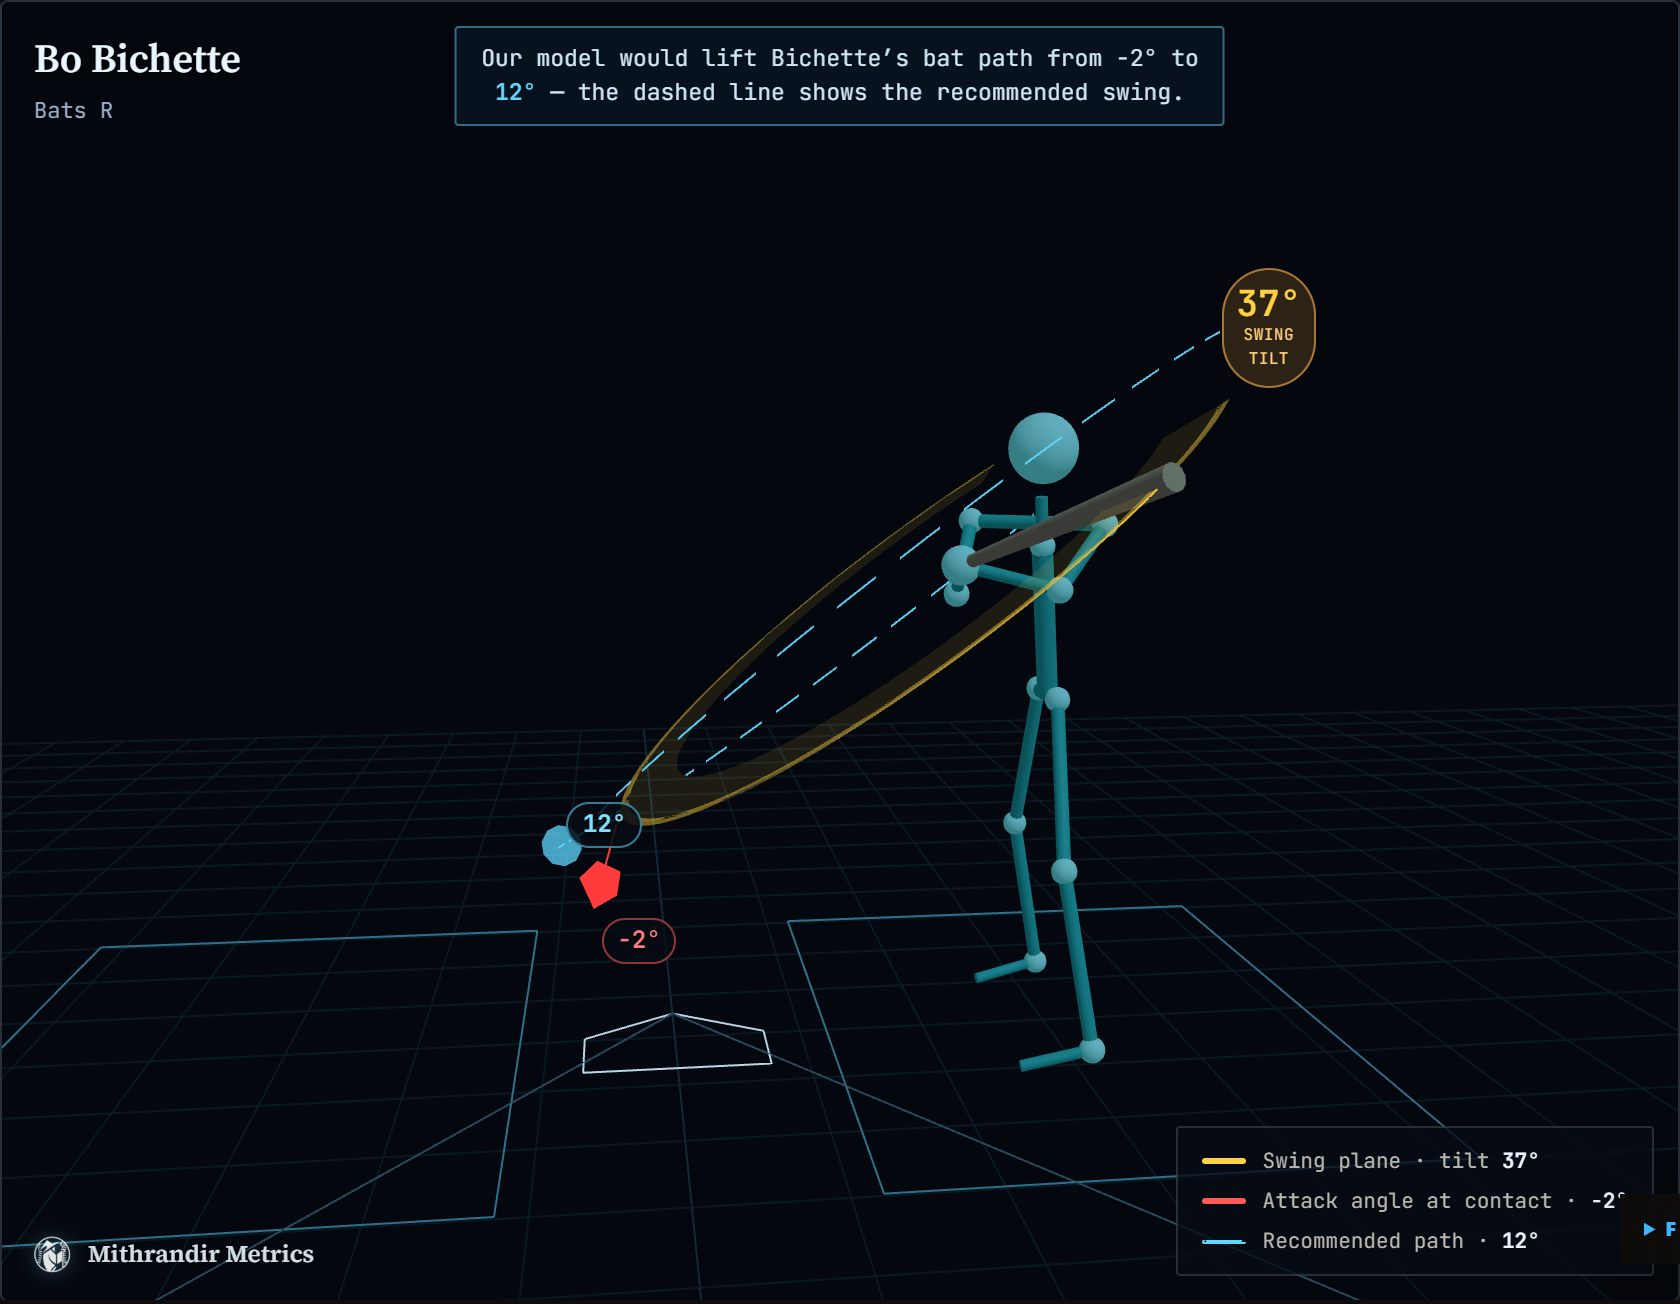
Real bat tracking, rebuilt as a full 3D swing: an animated batter sweeping his true swing plane, every angle annotated against the MLB average. When our optimization model sees a flat path, the recommended swing overlays as a dashed target. Search any hitter in the league.
The Mirror is our PA-by-PA Monte Carlo engine: real lineups, arsenals, bullpen logic, park and weather, run thousands of times into win probabilities, projected totals and starter strikeouts, then re-simulated live from the actual game state inning by inning. Every call is graded against what really happened on the Sim Record.
Any pitcher vs any hitter, pitch by pitch in 3D. The arsenal flies to the plate, the hitter's holes light up red, and the out pitch surfaces itself.
Open the Matchup Dissector →Who is this hitter built like? A star map of profile-shape comps over six feature groups, with the why behind every match and an honest sparse sky when no true twin exists.
Open the Comp Constellation →A starter against a full lineup: the top threats, the easiest outs, the pitch to attack each hitter, and the sleeper the box score hides.
Open the Scouting Report →Actual pace 96.5 wins against 73.0 projected over 94 games.
26.7 IP sample; current-season indicators are driving the delta.
Large band; direction negative.
Leaderboard snapshot 2026-07-17. The category rotates daily; repeated names mean the same players still lead the selected metric.
 01
Yordan AlvarezHouston Astros / 420 PA
221
01
Yordan AlvarezHouston Astros / 420 PA
221
 02
James WoodWashington Nationals / 454 PA
212
02
James WoodWashington Nationals / 454 PA
212
 03
Ben RiceNew York Yankees / 390 PA
202
03
Ben RiceNew York Yankees / 390 PA
202
 04
Matt OlsonAtlanta Braves / 416 PA
198
04
Matt OlsonAtlanta Braves / 416 PA
198
 05
Kyle SchwarberPhiladelphia Phillies / 418 PA
198
View complete leaderboard 2026-07-17
05
Kyle SchwarberPhiladelphia Phillies / 418 PA
198
View complete leaderboard 2026-07-17


 Otto Lopez
 Luis Arraez
 Jacob Misiorowski
 Cam Schlittler